
Putting CCREC Grant-Level Dashboards to Work
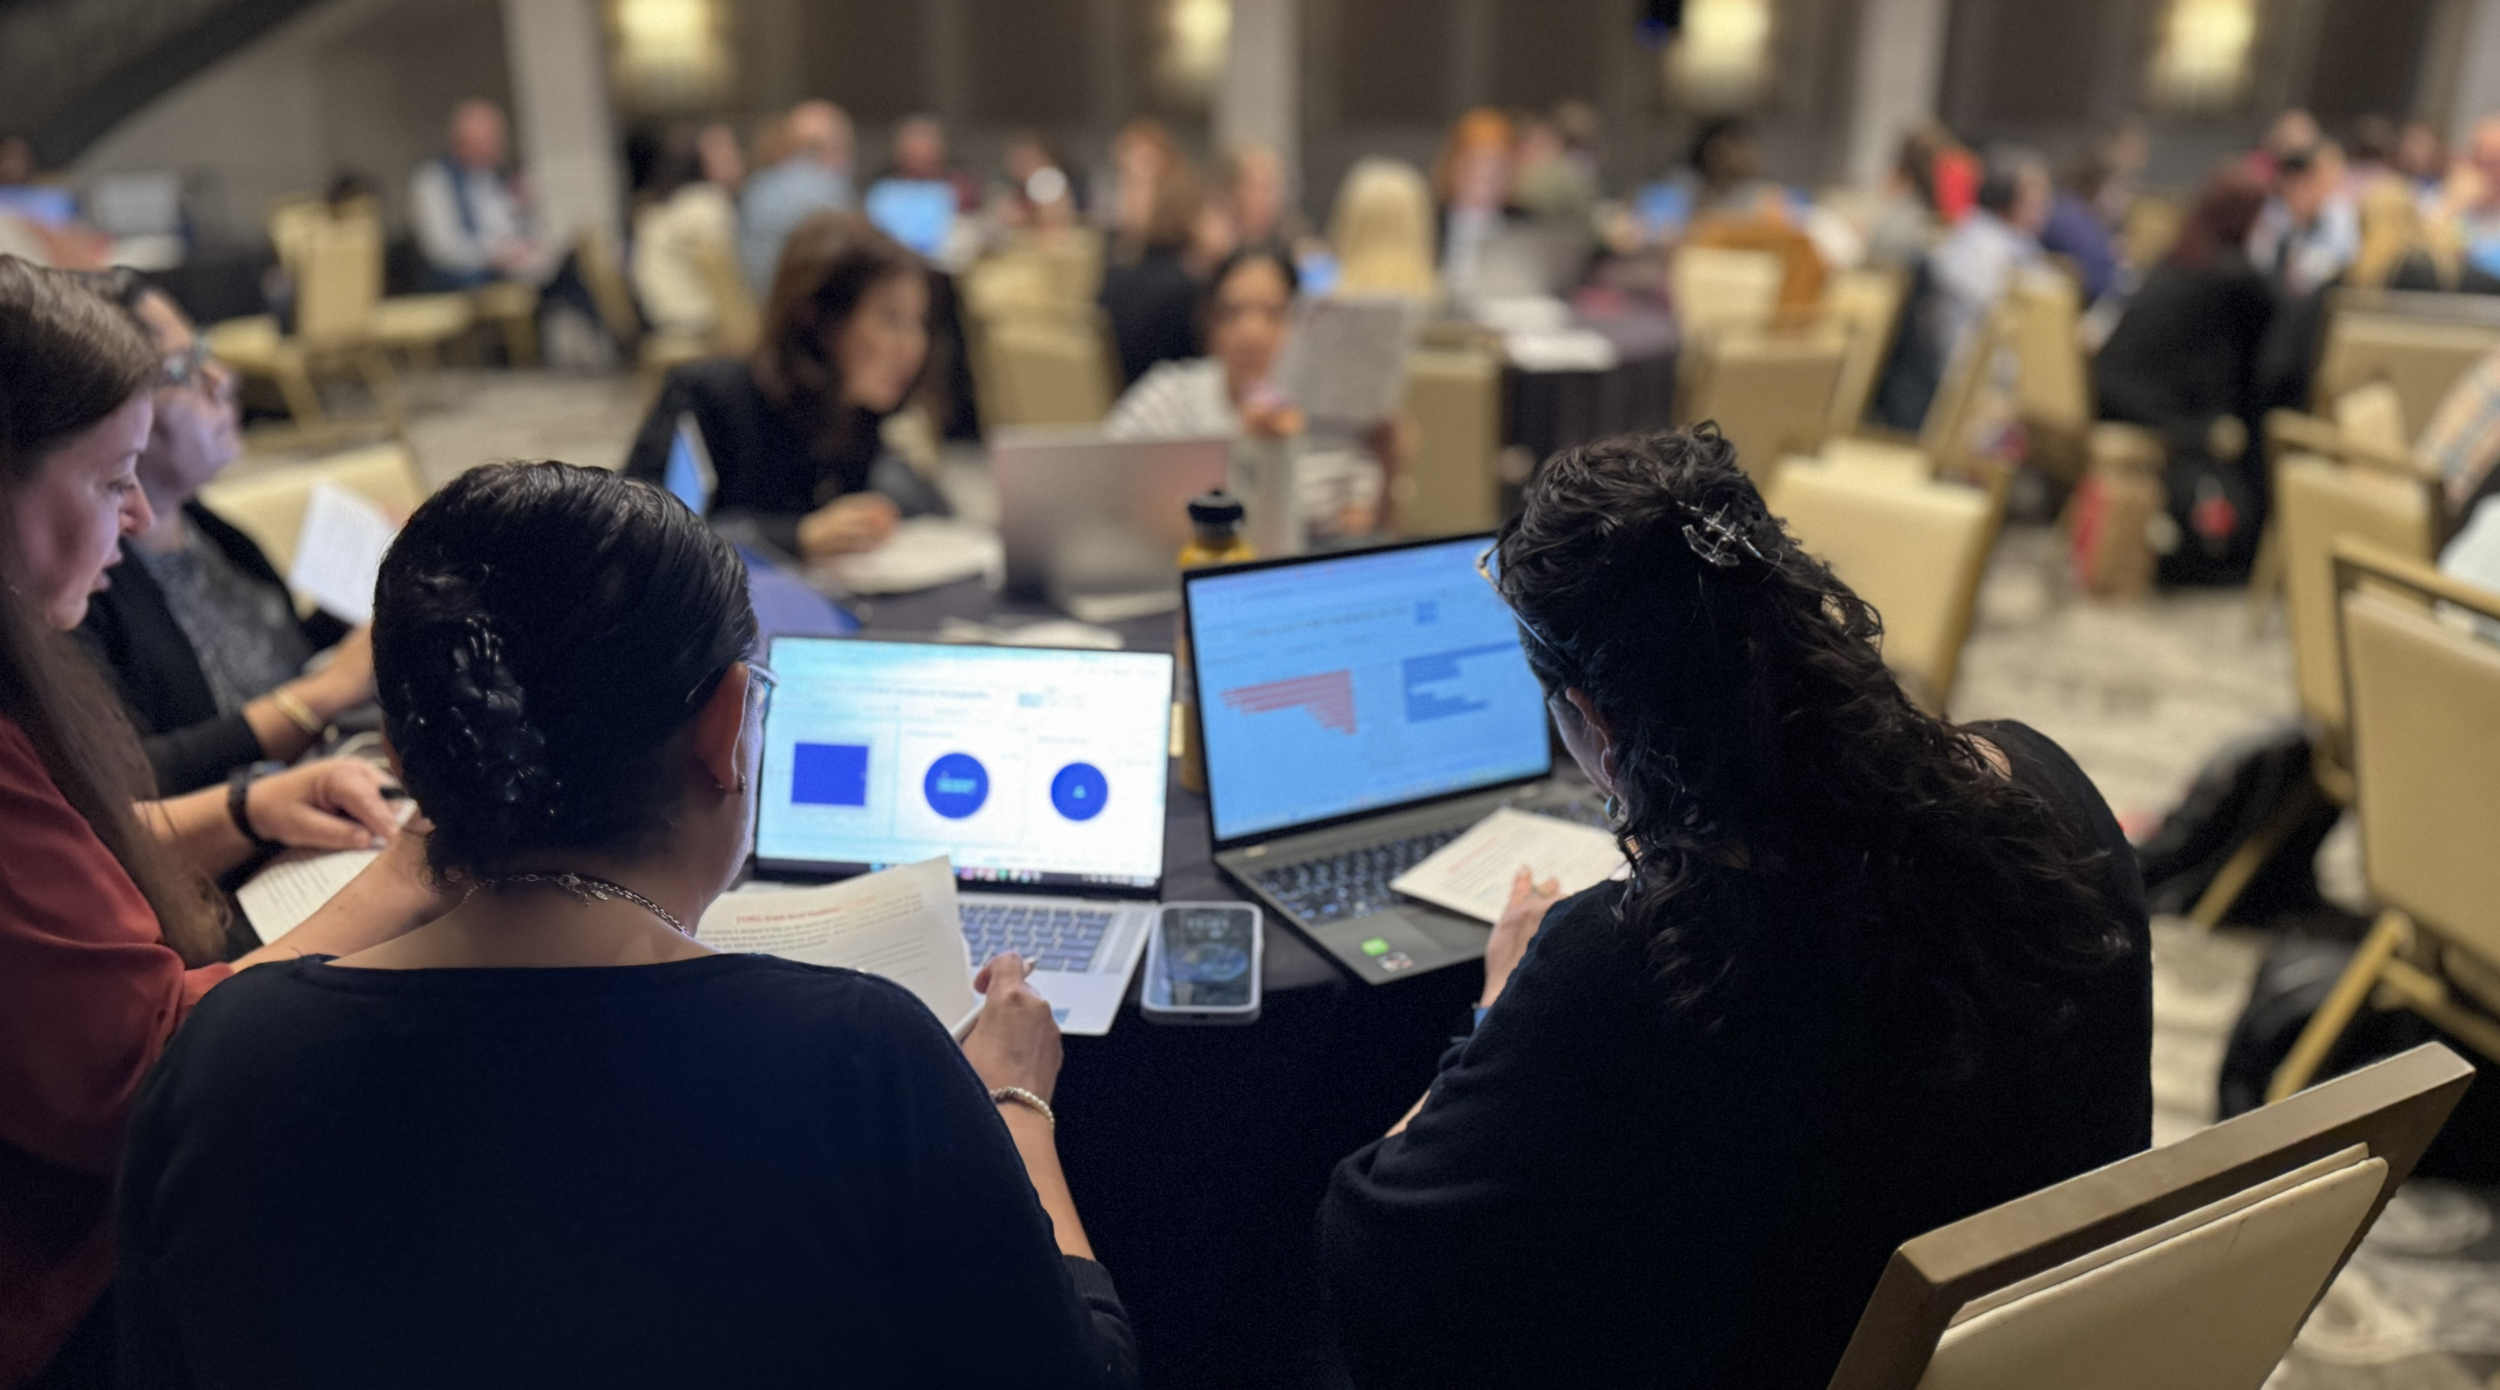
There’s a unique energy that comes from gathering face-to-face. Last month, members of the College and Career Readiness Evaluation Consortium (CCREC), a network of GEAR UP evaluators, data professionals, and program leaders from across the country, gathered to share ideas, explore data, and learn side by side.
Many participants shared that the meeting was a valuable learning experience, offered useful information, and created meaningful opportunities to connect with other CCREC professionals. These moments matter. In a field where much of the work happens behind the scenes—in datasets, reports, and systems—having the opportunity to step back, collaborate, and learn alongside others doing similar work is rare and important.
A standout moment was unveiling the CCREC grant-level dashboard. What followed in that session was nothing short of impressive. More than 100 participants—with different computers, security constraints, and technical backgrounds—successfully downloaded, set up, and ran a local dashboard using Python in under an hour.
This kind of success does not happen by accident. It speaks to the strength of this community, the willingness to lean in and try something new, and the thoughtful design behind the tools themselves. What could have easily been a frustrating technical session turned into a shared moment of learning and problem-solving—and you all made it work.
A big thank you to Alex Sutherland from Montana GEAR UP for building the dashboard and making this work possible. Thanks as well to the Xcalibur team for their contributions to the training materials and their support during the session, and to CCREC leadership for their guidance in shaping this effort for grants across the consortium. But ultimately, it was the collective effort in that room—the willingness to try, troubleshoot, and push through challenges together—that made it successful.
Participants rated the dashboard session highly, and it was clear there’s a strong interest in using these tools to better understand and leverage your data. In San Antonio, we focused heavily on the how—how to navigate the files, download the dashboard, and run it locally. That was necessary.
But the real vision for the CCREC Grant-Level Dashboard goes beyond the technical. It’s about helping grantees:
- See your grant in the context of the broader consortium.
- Explore patterns in participation, services, and outcomes.
- Ask better questions about your data.
- Make more informed decisions for your students.
The dashboard was never meant to be just another tool—it’s meant to connect your local story to a larger one.
At its core, this work is about more than dashboards. It’s about how grants use data. The most effective GEAR UP programs don’t just collect data for reporting purposes. They use it as a learning tool. They look for patterns, ask questions, and use what they find to refine their approach over time. Data becomes less about compliance and more about curiosity, helping us understand what’s working, for whom, and where there may be gaps.
When used well, data helps move conversations from assumptions to evidence. Instead of asking, “Do we think this is working?”, teams can ask, “What does the data show us, and what should we do about it?” That shift is where continuous improvement happens.
It also strengthens how grants tell their story. GEAR UP programs do meaningful, complex work every day, but that impact isn’t always easy to see without the right lens. Data helps make that work visible. It allows programs to clearly demonstrate progress, highlight successes, and communicate challenges in ways that build understanding and support among stakeholders. And, just as importantly, it helps connect the dots.
Participation data, service delivery, and student outcomes are already central to evaluation work. Tools like the CCREC Grant-Level Dashboard bring these pieces together, making it easier to explore those connections—helping programs see how engagement aligns with outcomes, where momentum is building, and where additional attention may be needed. These tools don’t replace the expertise of the people doing the work; they enhance it. They create space for exploration, reflection, and more informed decision-making. And when used across grants, they support shared learning—allowing programs to see not only their own progress, but also how it compares and connects with others across the consortium.
That idea—connecting local work to a broader, shared understanding—has always been at the heart of CCREC. Dr. Chrissy Tillery, Vice President of Research and Evaluation at the National Council for Community and Education Partnerships, explains:
“In CCREC, we have always had the intent to embed local data to supplement our multi-grant longitudinal, summative evaluation. By giving grantees tools to strengthen and understand their local data better, our collective outcomes improve. Alex Sutherland from Montana GEAR UP did a wonderful job combining the technical with the practical to showcase how to fill a much-needed gap in CCREC.”
This is what makes the dashboard more than just a reporting tool—it’s a bridge between individual grant efforts and the larger story we’re telling together. And that shared lens matters.
One of the most powerful aspects of the CCREC Grant-Level Dashboard is the ability for grants to start from the same place. As Alex Sutherland, who built the dashboard, put it:
“I would love to see the dashboard used as a way for CCREC grants to compare data from the same starting point and be able to look at the same charts.”
This consistency enables deeper conversations, stronger collaboration, and more meaningful shared learning across the consortium.
Like most good work, it doesn’t happen all at once. If you left San Antonio thinking, “This is great, but I need time to actually sit down and do it,” you are not alone. That is why we are continuing this work.
CCREC is hosting an open office hour session to support you as you take the next step. This will be a working session where you can get help downloading the dashboard files, accessing and downloading your CCREC data, running the dashboard with your own data, and troubleshooting any issues you encounter. There will be no slides or formal presentation—just dedicated time to do the work with support. CCREC participants have shared a desire for more hands-on time, deeper data exploration, and additional technical support to apply what was introduced. This session is designed to meet that need. The value of the dashboard isn’t in what it can do; it’s in what you actually do with it.
CCREC Local Dashboard: Office Hours with Alex Sutherland
🗓️ April 20, 2026
🕒 2:00–3:00 PM EST
CCREC members should have received a calendar invite from Thomas Cech—if not, just reach out and we’ll provide the details.
We are excited to see how you take this tool, make it your own, and use it to develop insights about your grant, inform continuous improvement, and ultimately better support the students you serve. This is the work of CCREC—learning from one another and continuously elevating the work together.